
Business dashboards
We connect the sources where the data already lives (your CRM, invoicing, website, till system, the same old spreadsheet) and turn them into a dashboard that updates itself. A few indicators, the ones that change a decision, and none that need filling in by hand.
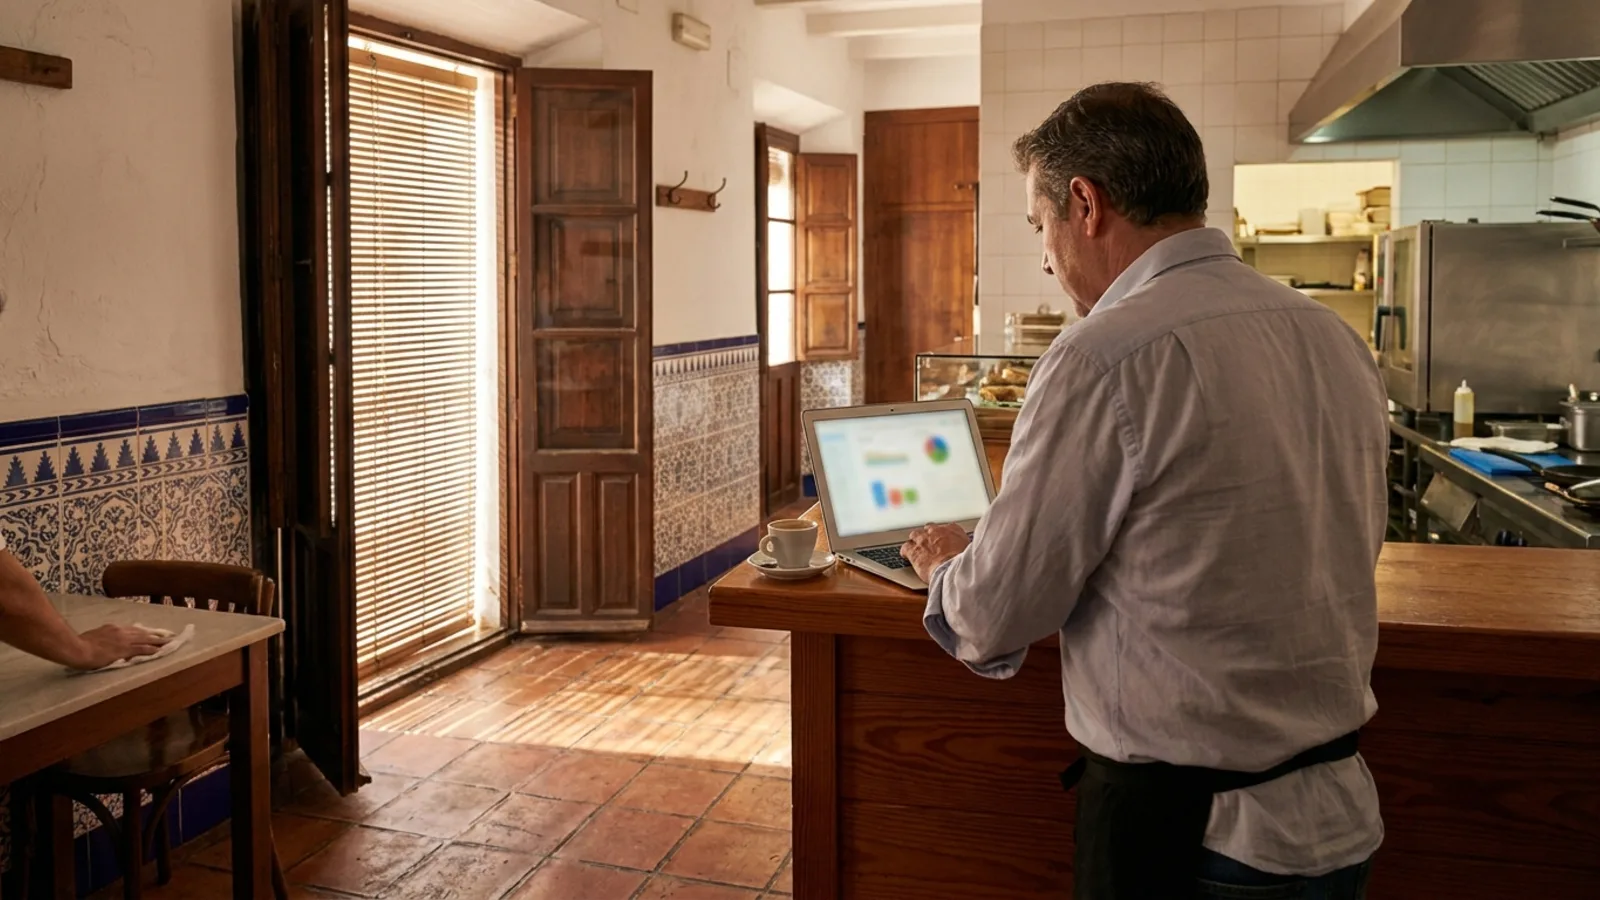
To see how the month is going you open four places: the invoicing software, the bank, the same old Excel file and the website stats. You reconcile them by hand, and by the time you finish the figure is a week old. Or you don't (which is what usually happens) and you decide by gut feeling. A dashboard exists so that question answers itself, by looking at one screen, whenever you need it.
What questions does your dashboard need to answer?
Before drawing any chart we make the list of questions. The usual ones tend to be five or six: how much have I invoiced this month and how does it compare with last month, what am I owed and since when, which product or service is pulling its weight and which sells just because it's there, where new customers come from and how much it costs me to win one. If you never ask a question, its chart is surplus. And the other way round: if you ask it every week and today you answer it by opening three programs, that's exactly the one that needs to be right at the top. The dashboard is designed from that list, not from what the tool happens to be able to draw.
A dashboard doesn't fix bad data
This is the awkward part and we'd rather say it before selling you the chart: if the information is incomplete or everyone enters it their own way, the dashboard shows that mess, only prettier. A customer set up three times with their name spelt differently is three customers on the chart. And a number you don't believe doesn't get used: it's looked at once, doubted, and it's back to Excel. That's why the groundwork often isn't drawing anything, it's putting the data in order: deciding what each thing is called, who enters it and what happens when it's missing. That's where the effort goes, and it has to be said before starting.
A few numbers, or none get looked at
Nobody looks at a dashboard with forty numbers. It's opened on day one, someone says "how thorough" and nobody comes back. The rule we use is simple: an indicator stays if seeing it would make you change something. If the number goes up or down and you do exactly the same, that number is decoration. We learnt this in-house: this website used to have a block of good-looking metrics (satisfaction, return, time to launch) that didn't come from anywhere. They measured nothing and decided nothing. We removed them. Better five figures you can defend in front of a customer than forty that are just for show.
Where does the data come from? From where it already is
We don't ask you to change tools. The data already exists somewhere: in the CRM, the invoicing software, the till system, the website stats, the payment gateway, that spreadsheet that has been the company's real system for years. What we do is fetch it from where it is, via API or whatever route each system allows, and put it in one shared place the dashboard draws from. It's the same work behind our systems integration service, with a layer on top that displays it. And if a source won't let itself be connected, we'll tell you in the first conversation.
If someone has to export by hand every Monday, it isn't a dashboard
The value isn't in the chart: it's in nobody having to update it. A panel that relies on someone exporting a CSV every Monday and pasting it into a tab doesn't last: until the first holiday or the first hectic Monday. After that it's out of date again, and an out-of-date panel is worse than none, because someone makes decisions with it believing it's current. That's why we build it to refresh itself, as often as each piece of data needs: invoicing doesn't need to be up to the second, but today's sales are worth seeing today. And when a source stops responding, the dashboard says so instead of showing the last good figure as if it were from this morning.
When you don't need one
If you make two decisions a year, you don't need a dashboard: you need to sit down with the numbers for two afternoons. If your whole business fits in one program that already comes with its own reports and you look at them, you don't either: what you're missing isn't a panel, it's opening the one you have. And if you know the data is wrong and you're not going to sort it out, a dashboard will only make the problem more visible without solving it. Where it does pay off is in businesses with several sources that don't talk to each other and someone making decisions every week: buying, restocking, chasing payments harder, shifting ad spend.
Frequently asked questions
- Does it work if my data is in Excel?
- It does, on one condition: the sheet needs a stable structure. If a new column is added every month or the same item is written three different ways, the first step is sorting that out. A well-made spreadsheet is a perfectly valid source, and in many businesses it's the only one there is. It isn't a problem; it's the starting point.
- Does it also tell me what to do with the numbers?
- Not on its own. The dashboard is the thermometer: it's always on and answers how you're doing right now. Interpreting it (saying what has worked, what hasn't and what's worth changing) is a different job, and a person does that. The panel puts the number in front of you and removes the excuse of not having it; the decision is still yours. For some businesses, that's plenty.
- Can I see it on my phone?
- Yes, it's designed for mobile from the start, because that's where it gets looked at: first thing, with a coffee, before going in. The three or four figures that matter at the top and the detail below, for anyone who wants to scroll down. And with access per user, because not everyone in the company needs to see the margin.
- How much does it cost to set one up?
- It depends on how many sources need connecting and what state the data is in, which is what really drives the work. A panel on an orderly system is nothing like one that starts by putting things in order. Tell us where the numbers would come from and we'll tell you what yours would cost, before starting anything.
How we work
01
Understand
We sit down with you and look at how you really work. We come away knowing what makes sense to build and, above all, what doesn't.
02
Build
We build it on the tools you already use and show it to you working, not in a slide deck.
03
Stay with you
We measure, we adjust and you can always reach us. Software isn't something you install and forget.
Other services
Chatbots and conversational AI
Assistants that talk to your customers on WhatsApp and actually sort things out.
See detailsWeb development
Custom websites and platforms, with AI built in from day one.
See detailsCustom applications
Software that doesn't exist on the market because your process is yours.
See details